⚡ x4 faster Metric Sheet Table and Pivot table are not the only visualizations to get a speed boost here. We promised a faster Metric Sheet, and we delivered. Metric sheet is now x4 faster!
Holistics Data
Software Development
We are the new age of #Businessintelligence and #Data platform!
About us
Holistics offers both experiences in the same platform: a SQL-friendly interface for data analysts and self-service experience for non-technical users. Analytics should not be done in silos across different teams with different skill sets and different ways they transform/manipulate/use data as that has downstream effects on the usability of it. Holistics connects data and business teams together, we make data work for you! * Try Holistics for free: https://www.holistics.io/request-trial/ * Product demo overview: https://www.holistics.io
- Website
-
https://www.holistics.io
External link for Holistics Data
- Industry
- Software Development
- Company size
- 51-200 employees
- Headquarters
- Central Business District
- Type
- Privately Held
- Founded
- 2015
- Specialties
- Business Intelligence, Data Transformation, Data Analytics, Big Data, Data Reporting, Data Warehouse, Business Analytics, Data Engineer, Data Analysts, Embedded Analytics, Dashboard, ETL, Report Automation, Self-service BI, and Cloud Computing
Locations
-
Primary
Get directions
14 Robinson Rd
Central Business District, SG
Employees at Holistics Data
Updates
-
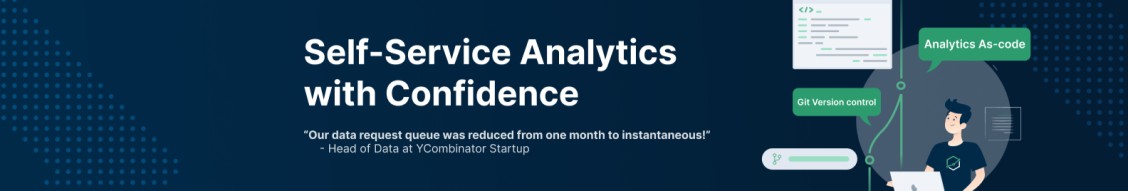
⏰ Git Version Restore We are thrilled to introduce Version Restore - a new feature that lets you restore AML (Analytics Modeling Language) projects to any version and make your experience with our AML a lot more enjoyable. Ever found yourself in these situations? - You’re diving into Holistics, changing stuff to see what’s what. Suddenly, you changed something which broke some other things, and you wish you could hit an “undo” button. - Knowing there’s no “oops” button, you tread so lightly you barely explore Holistics. Where’s the fun in that? - You decide to try out new ways of building metrics or modeling data. But things go sideways, and the only way back is a bunch of complex git commands. Version Restore can help you avoid these situations. Roll back your AML project to any version you want, making exploration and innovation super easy. Here’s how it works:
-
🌊 Trend line in just a few clicks When exploring data, you want to know what’s hidden from plain sight, or what the future looks like. After all, they’re the bread and butter of data-informed decision-making, and they’re now much simpler to achieve with Holistics. Soon, you’ll be able to add trend lines in just a few clicks to forecast data patterns or identify trends that might slip through the cracks.
-
-
🛺 Freeform layout, without misalignment With Canvas Dashboard, you can easily freeform your layout - toss and shuffle visualizations, filters, text on a blank canvas however you like. Yet, free form often comes with alignment. Having the freedom to place things anywhere can lead to a bit of a mess. We know. This is why we’ve added handy guides for block alignment in the Canvas Dashboard. You can now drag and drop, freely, without stressing about getting everything lined up just right.
-
🤖 Drop unused jobs, automatically Imagine this: At 9 a.m., one of your marketing executives opens Holistics for their daily data browsing. They spot some new marketing dashboards. Excited to see what’s what, they open them all. However, they then get caught up in urgent marketing tasks, so before they can do any insight digging, they turn back and exit. Unbeknownst to them, the job triggered during their initial visit keeps running in the background, hogging a Job Worker, and blocking it from being used for more pressing reports. To solve this, we proudly introduce 🤖 **Auto Cancellation for Unused Jobs.** This feature allows you to set a timeout (e.g. 3 seconds), and any lingering job gets axed, automatically, freeing the Job Worker for other important tasks!
-
🚗 Disable Dashboard Autoload If you're using Holistics, you can now set your dashboard to "not auto-run by default", i.e only run after users clicks Run. This prevents sending unnecessary queries to your Snowflake or BigQuery data warehouse, hence increasing user experience and saving you a fair amount of DW cost. autoload.mp4 This is also particularly useful for dashboards where users want to select/drill down to some condition before running (e.g lookup dashboard). #businessintelligencetools #dataanlytics
-
🏗 Condition Group (aka AND/OR filter) Filtering data in Holistics just got a little more flexible. You can now create complex filtering conditions with AND/OR filtering. This seems trivial but among the most requested feature in Holistics platform. Here’s what the feature brings: - Create OR conditions between different fields - Group conditions together and create groups within groups - Set AND/OR relationships between conditions
-
🥻 Draw your line in style. If you're a Holistics user, you can now customize the line style of your charts. Choose from style options like solid, dotted, or dashed; then choose from linear, smooth, or step-line interpolation for more variety of data representation. A good chart is a chart with great visual clarity. And this little feature hopefully help analysts get closer to creating one.